Missing Logs – Google Logs Viewer

I opened a new GCP project to host a Python application when I hit a problem – my logging.info() and logging.warn() statements weren’t showing up in my logs. Then I realized the standard error and standard out streams weren’t selected in logging!

If you’re missing log information, make sure to select the correct streams in the second dropdown box, as in below:

Screenshot of logging, selecting stderr and stdout streams.

100% Logs Stored Data On Free Tier Applications

Some heavily-trafficked free tier applications may find themselves with a full Logs quota bar, similar to the below screen:

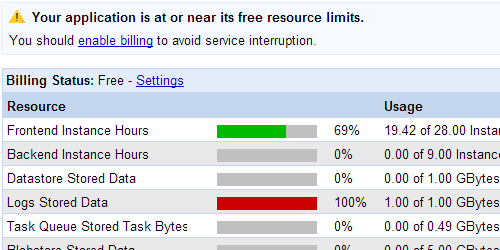
For free tier applications, App Engine will retain 1 GB of logs over the last 90 days. This quota doesn’t reset on a daily basis like other quotas do; instead, it shows how much logging data has been retained over the last 90 days. In this example screenshot the demonstration application has 1 GB of logging data stored, so the logs quota shows a full red bar.

App Engine will pop up a billing notice whenever there is a full quota bar (as in the above screen) and it’s a good idea to enable billing if you need to retain more logs for a longer period of time. However, if you’re only interested in the recent logs, you don’t need to enable billing. App Engine implements logs as a FIFO queue: new logs are added in, and old logs are deleted out.

In short: if your application’s logs quota is full, you only need to enable billing to retain the older logs. The logs for fresh/recent requests will always be available.

Logging In PHP

A quick note: here’s how to write a line of text into logging on the PHP runtime:

syslog(LOG_INFO, "Log Text: " . $variable_to_log);

The first argument can be replaced with standard PHP logging levels, such as LOG_WARNING.

A reminder: App Engine ignores calls to openlog() and closelog() . While you can still call these functions (for instance if you have legacy code), they will not affect logging.

Logging API Example

Here’s an example of how to use the Logging API to inspect an application’s logs. This function extracts all logs dated within the last hour, averages the execution time of all requests, and records how many requests resulted in errors (in other words recorded a FATAL level log report).

The String this function returns will look like this:

In the last 1 hour, requests took an average of 
451255 microseconds (451 ms) to execute. 0 errors reported.

This function is entirely self-contained; you don’t need to pass in any variables or set any global variables. However it needs to be run within an App Engine environment, either production or development.

public String doLogExam() {
    /**
     * For this example, we'll look into this application's logs, pull out the last few logs, 
     * and calculate the average length of servlet requests. 
     * We'll also examine each line of the log and see if there are any errors reported.
     */
    //Access the log service, pull out logs, and grab an Iterator over the logs.
    LogService log = LogServiceFactory.getLogService();
    //Get all logs starting from 1 hour ago.
    long end_time = (new java.util.Date()).getTime();
    long start_time = end_time - (1000 * 60 * 60 * 1);
    LogQuery q = LogQuery.Builder.withDefaults().includeAppLogs(true).startTimeMillis(start_time).endTimeMillis(end_time);
    Iterator<RequestLogs> log_iterator = log.fetch(q).iterator();
    //Holds the sum of the execution time of all HTTP requests; we'll divide this by the 
    //num_of_logs_counted to get the average execution time.
    long execution_time_microseconds_sum = 0;
    //Number of log lines that are reporting errors.
    int num_of_error_log_lines = 0;
    //Number of logs that we pulled out of the LogService
    int num_of_logs_counted = 0;
    //Iterate over each log.
    while (log_iterator.hasNext()) {
        //Each request_log represents a single HTTP request.
        RequestLogs request_log = log_iterator.next();
        num_of_logs_counted++;
        //Retrieve the execution time of this request, and add it to our sum variable.
        long execution_time_microseconds = request_log.getLatencyUsec();
        execution_time_microseconds_sum = execution_time_microseconds_sum + execution_time_microseconds;
        //Pull out any lines in this request log, and examine them to see 
        //if they report an error.
        List<AppLogLine> log_line_list = request_log.getAppLogLines();
        for (int i = 0; i < log_line_list.size(); i++) {
            AppLogLine app_log_line = log_line_list.get(i);
            LogService.LogLevel line_level = app_log_line.getLogLevel();
            //If this log line's reporting level is classified as fatal 
            //(causing the request to fail), record it.
            if (LogService.LogLevel.FATAL.equals(line_level)) {
                num_of_error_log_lines++;
            }
        }//end looping through each line of the request log
    }//End looping through each request log
    long avg_execution_time_microsec = (execution_time_microseconds_sum / num_of_logs_counted);
    long avg_execution_time_millisec = avg_execution_time_microsec / 1000;
    String comment_text = "In the last 1 hour, requests took an average of ";
    comment_text += avg_execution_time_microsec + " microseconds (" + avg_execution_time_millisec;
    comment_text += " ms) to execute. " + num_of_error_log_lines + " errors reported.";
    return comment_text;
}

Remember to import the following classes:

import java.util.Iterator;
import java.util.List;
import com.google.appengine.api.log.AppLogLine;
import com.google.appengine.api.log.LogQuery;
import com.google.appengine.api.log.LogService;
import com.google.appengine.api.log.LogServiceFactory;
import com.google.appengine.api.log.RequestLogs;

Simple Logging In Java

In most applications, it’s a good idea to use a robust logging framework such as java.util.logging.* or log4j. However, when you’re writing simpler App Engine applications there is an alternative: use System.out and System.err.

App Engine catches all output written to the standard output streams System.out/System.err and prints it into the application’s logs. So logging a message is as simple as writing one line of code:

System.out.println("This is an informational logging line.");

Use the System.err stream to log an error:

System.err.println("Exception: " + e.getMessage());

If you do decide to log informational messages, you also need to set the logging level to INFO. Open up the logging.properties file in the /war/WEB-INF/ directory:

Change the .level property to INFO:

.level = INFO

Now your App Engine application will record and display all logs sent to System.out and System.err.